
2026 Home Ownership Statistics: State-by-State Breakdown
Key home ownership data findings:
- Current national rate: As of mid-2024, the home ownership rate in the U.S. was 65.6%. This is down from a peak of 69% in 2004.
- Age disparity: Yes, the overall home ownership rate in the U.S. is currently 65.6%, but age is more than just a number when it comes to home ownership. Only 38.6% of people under 35 own a home, compared to 79% of those over 65.
- Racial disparities: White home ownership rate is highest at 72.3%, followed by Asian Americans at 63.3%. 51.1% of Hispanic Americans own their homes, while it’s just 44.1% for Black Americans.
- Mortgage-free homes: As baby boomers age, the percentage of homes owned free and clear has been steadily increasing. It has increased from 32.78% in 2010 to 39.28% in 2022.
- Single-family home ownership statistics: Single-family homes remain the dominant housing type for U.S. homeowners. The ownership rate for single-family homes is 86.1%. This contrasts with the much lower ownership rate of 12-14% in multifamily buildings.
- State-by-state breakdown: Looking at home ownership statistics by state, West Virginia has the highest ownership rate at 75.4%. On the other end, the state of New York has the lowest home ownership rate at just 54.8%.
In this article, you’ll get the latest home ownership stats, including the state-by-state breakdown of U.S. home ownership and home ownership statistics by gender and race.
Statistics used in this article were obtained from the U.S. Census Bureau, the National Association of Realtors (NAR), the Federal Reserve Bank of St. Louis, and other top housing data sources.
Home Ownership Statistics: National Overview

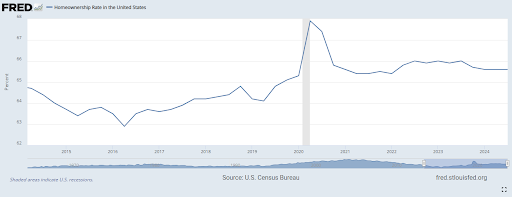
The U.S. home ownership rate has seen fluctuations over the years. As of the second quarter of 2024, it was 65.6%. 2004 saw the rates peak at 69%. In 2016, the U.S. home ownership rate hit its lowest point in recent years, at 63.4%.
Post-2016, the home ownership rate by year started climbing, reaching 66.6% in 2020. This recovery was driven largely by younger households and lower interest rates. Despite some ups and downs, the rate has fluctuated most often between 63% and 67% over the last decade.
Right now, in 2024, about 65.6% of Americans own their home, a small but noteworthy decrease from 65.9% last year.
Back in 2022, it dipped to 65.8% because of rising interest rates and inflation. Just a year before, in 2021, as housing prices rose, the home ownership rate dipped to 65.5% from 66.6% in 2020, thanks to mortgage interest rate uncertainties.
U.S. Home Ownership Rates
| Year | Rate of Home Ownership (%) |
| 2008 | 67.82 |
| 2009 | 67.37 |
| 2010 | 66.85 |
| 2011 | 66.15 |
| 2012 | 65.45 |
| 2013 | 65.12 |
| 2014 | 64.47 |
| 2015 | 63.65 |
| 2016 | 63.40 |
| 2017 | 63.85 |
| 2018 | 64.42 |
| 2019 | 64.55 |
| 2020 | 66.60 |
| 2021 | 65.47 |
| 2022 | 65.77 |
| 2023 | 65.90 |
| 2024 | 65.60 |
USA Home Ownership Statistics by State
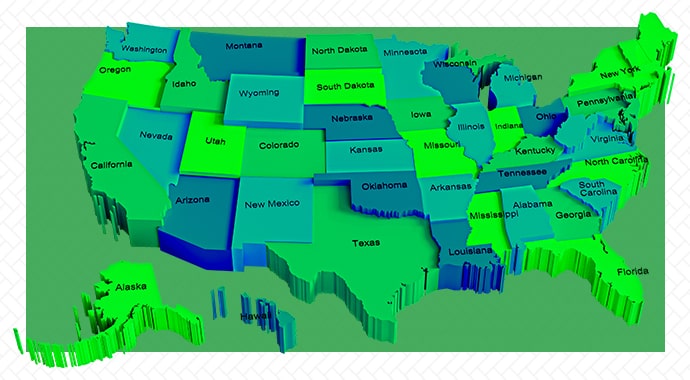
By using Census Bureau and real estate market analysis data, we have analyzed home ownership statistics by state in the U.S. as of quarter 3 of 2024. We calculated the median home ownership for each state by using the U.S. Census Bureau’s quarterly data on state-by-state home ownership.
What we found was that up in the Northeast, states like Maine, New Hampshire, and Vermont show strong traditions of home ownership. Even Southern states like Alabama, Mississippi, and South Carolina are doing the same.
But things are different on the West Coast. California’s famous sunshine and allure are just too expensive for would-be home buyers, with Oregon and Washington facing similar struggles.
Home Ownership Rates for Each State of the U.S.
| State Code |
Home Ownership Rate in 2024 (%) |
| AL | 73.32 |
| AK | 64.45 |
| AZ | 69.42 |
| AR | 67.60 |
| CA | 55.62 |
| CO | 66.75 |
| CT | 69.47 |
| DE | 73.17 |
| FL | 69.45 |
| GA | 67.75 |
| HI | 59.45 |
| ID | 71.17 |
| IL | 68.17 |
| IN | 70.52 |
| IA | 71.35 |
| KS | 67.47 |
| KY | 70.97 |
| LA | 69.12 |
| ME | 74.10 |
| MD | 68.45 |
| MA | 64.35 |
| MI | 71.75 |
| MN | 70.92 |
| MS | 70.95 |
| MO | 70.72 |
| MT | 69.17 |
| NE | 68.95 |
| NV | 62.45 |
| NH | 73.35 |
| NJ | 66.75 |
| NM | 67.72 |
| NY | 54.75 |
| NC | 69.65 |
| ND | 67.70 |
| OH | 69.77 |
| OK | 68.45 |
| OR | 65.45 |
| PA | 71.72 |
| RI | 62.17 |
| SC | 71.97 |
| SD | 68.75 |
| TN | 68.95 |
| TX | 64.75 |
| UT | 71.47 |
| VT | 72.45 |
| VA | 69.72 |
| WA | 66.17 |
| WV | 75.37 |
| WI | 70.02 |
| WY | 70.90 |
Top 10 States with the Highest Home Ownership Rates
West Virginia leads with a 75.4% home ownership rate. Maine and New Hampshire follow close behind with robust housing markets that keep people in their homes longer. They boast the second- and third-highest rates.
73.3% of Alabama homes are owner-occupied. This shows that most residents prefer owning to renting, possibly due to the state’s affordability.
Delaware is nearly on par at 73.2%. Vermont has a high home ownership rate possibly because of its strong job market and home ownership programs.
Michigan has a 71.8% home ownership rate. Many people here have owned their homes for a long time, plus high home prices keep homeowners holding onto their homes.
Pennsylvania’s high percentage reflects strong local values favoring home ownership, while South Carolina and Utah’s growing economy also makes owning a home more feasible for many.
| State Code |
Home Ownership Rate (%) |
| WV | 75.37 |
| ME | 74.10 |
| NH | 73.35 |
| AL | 73.32 |
| DE | 73.17 |
| VT | 72.45 |
| MI | 71.75 |
| PA | 71.72 |
| SC | 71.97 |
| UT | 71.47 |
Top 10 States With the Lowest Home Ownership Rates
New York has the lowest homeownership rate nationwide — only 54.8% of homes are owner-occupied. This is because of the bustling urban life in its cities.
Close on its heels, California and Hawaii show similar trends, with ownership rates of 55.6% and 59.4%, respectively.
Rhode Island and Nevada have home ownership rates of 62.2% and 62.5%, respectively. You can link these low numbers to the high living costs and the number of tourists that visit these states year-round.
Massachusetts, Texas, Alaska, Oregon, and Washington also make the list, primarily because of their many urban hubs and rising housing costs.
| State Code |
Home Ownership Rate (%) |
| NY | 54.75 |
| CA | 55.62 |
| HI | 59.45 |
| RI | 62.17 |
| NV | 62.45 |
| MA | 64.35 |
| TX | 64.75 |
| AK | 64.45 |
| OR | 65.45 |
| WA | 66.17 |
Demographic Trends in U.S. Home Ownership

Here is a breakdown of home ownership rates in the U.S. by age, relationship status/gender, and race.
Home Ownership Statistics by Age
As of mid-2024, about 65.6% of Americans owned their home, but there is a clear age divide when you look at the U.S. home ownership rate by age group.
For young adults (under 35), it’s getting tougher. The homeownership rate in this group has dropped to 38.6% from a healthy 45% back in the ’90s.
Those aged 35-44 have a home ownership rate of 62.6%, and for 45-54 year-olds, it jumps to 70.5%. As careers and savings grow, so does their chance of owning a home.
Older adults (55+) sit at the top of the home ownership ladder. Those between 55-64 own homes at a rate of 75.7%, and for those who are 65 and older, it’s a whopping 79%.
According to research, the average U.S. home ownership rate by age is now 56 years old. This means home ownership is skewed towards older generations.
Based on reports from CNBC, close to 28% of 24-year-old Gen Zs are homeowners. This is higher when you compare it to the percentage of millennials who owned homes when they were 24 (24.5%).
But the millennial home ownership rate has improved. In 2023, millennials made up the largest share of home buyers, at 38%.
Home Ownership Rates by Age Group
| Age Group | Home Ownership Rate |
| Under 35 years | 38.6% |
| 35-44 years | 62.6% |
| 45-54 years | 70.5% |
| 55-64 years | 75.7% |
| Over 65 years | 79.0% |
Looking at generational home ownership trends, Baby Boomers represent the largest share of homeowners as of 2023, followed by Gen Xers. Millennial home ownership grew to 54.8% in 2023, from 52% in 2022.
| Age Group | Home Ownership Rate as of 2023 |
| Gen Z | 26.3% |
| Millennials | 54.8% |
| Gen X | 72.0% |
| Baby Boomers | 78.8% |
Home Ownership Statistics by Gender/Relationship Status
Data from the National Association of Realtors (NAR) shows that single women are now more likely to own homes than single men, thanks to improved wage equality, more family support, and the fact that women generally live longer.
Marriage and mortgages often go hand in hand. A whopping 80% of married adults own their home, while only 48% of single people can say the same. It’s clear that marital status plays a big role in deciding who owns a piece of the American Dream.
When it comes to buying a house, women are stepping up big time. Though they typically opt for larger mortgages, they often start with smaller down payments, pushing against financial boundaries to secure their homes.
Share of Home Buyers Based on Relationship Status and Gender
| Relationship Status/Gender | Share of Home Buyers (%) |
| Married Couple | 56 |
| Single Female | 60 |
| Single Male | 48 |
| Unmarried Couple | 43 |
| Other | 59 |
Home Ownership Statistics by Race
Based on NAR’s data, Black American home ownership rose to 44.1% in 2022 (a 1.6% increase compared to 2012).
That’s nearly a million more Black families with keys in their hands, yet they’re still playing catch-up compared to other racial and ethnic groups, not crossing the 45% mark just yet.
For Hispanic families, the home ownership rate leaped to 51.1% (an increase of 5.4% compared to 2012), translating into homes for over 3 million more families.
Asian American home ownership surged to 63.3% (6.1% increase), the highest climb among all. Close to 1.5 million more Asian American families bought homes, showing a strong upward trend.
White families’ homeownership rate increased to 72.3% (3.1% growth). That’s roughly 65,000 more white homeowners. They’ve maintained a home ownership rate greater than 70% since 2017.
Share of Homeowners by Race
| Race | Home Ownership Rate |
| White | 72.3% |
| Black | 44.1% |
| Asian | 63.3% |
| Hispanic | 51.1% |
U.S. Second Home Ownership Rates
Based on data from the NAHB’s Eye on Housing, Florida’s 19th Congressional District leads the U.S. in second home ownership with 123,853 second homes. In contrast, Wyoming’s At-Large Congressional District has only 17,623.
Michigan’s 1st Congressional District has the highest share of second homes per district. Here, nearly a quarter of all properties are vacation homes or second homes. Wisconsin’s 7th Congressional District isn’t far behind, with 82,755 second homes.
Second Home Ownership Statistics
- In 2023, there were 5.7 million second homes in the U.S., representing 4% of the total housing stock.
- Second home demand has been declining, with mortgage-rate locks for second homes falling 13.1% year-over-year in August 2024 to the lowest level since March 2016.
- Half of the nation’s second homes are concentrated in a few congressional districts, mainly in Florida, California, New York, Texas, Michigan, North Carolina, Pennsylvania, and Arizona.
- The state of Florida has the highest percentage of second homes, accounting for 15.8% of the total number of second homes in the U.S.
- By Congressional District, Michigan’s 1st Congressional District has the highest share of second homes, with 24.5% of its housing stock classified as second homes.
- Wisconsin’s 7th Congressional District has almost 20% of its housing stock as second homes.
- Wyoming’s At-Large Congressional District has the smallest stock of second homes, with approximately 17,623 second homes.
Single Family Home Ownership Statistics
Most Americans choose single-family houses when buying a home. As of the latest census data in 2022, 86.1% of people living in detached homes (single-family homes) own their homes. Attached houses (townhouses) also have a high home ownership rate of 64.5%.
However, in condos (or multifamily buildings which allow individual ownership) with less than 20 units, only 14.3% of occupants own their units.
Similarly, in condos with more than 20 units (including high-rise buildings with a large number of housing units), only 12.6-13.5% of occupants own their units.
Home ownership also varies widely by region. The Midwest, for example, areas like Grand Rapids and Detroit boast some of the highest home ownership rates in the country.
High-end cities like Los Angeles and New York have low home ownership rates because of the high cost of living.
Home Ownership by Residential Building Type (in the top 56 Metro Areas)
| Major Metropolitan Area | Overall | Single Family Homes |
Townhouses |
Condo 2-19 units | Condo 20-49 units | Condo 50+ units |
| Atlanta, GA | 66.50% | 85.70% | 73.80% | 7.00% | 10.30% | 14.90% |
| Austin, TX | 58.80% | 85.40% | 59.30% | 6.40% | 3.00% | 5.90% |
| Baltimore, MD | 67.30% | 93.60% | 69.80% | 15.10% | 22.20% | 11.00% |
| Birmingham, AL | 69.50% | 84.80% | 67.40% | 3.70% | 4.80% | 6.00% |
| Boston, MA-NH | 61.50% | 93.90% | 69.40% | 30.10% | 20.60% | 16.60% |
| Buffalo, NY | 66.10% | 91.50% | 58.40% | 20.80% | 10.00% | 6.60% |
| Charlotte, NC-SC | 65.80% | 84.20% | 67.30% | 6.80% | 5.20% | 5.90% |
| Chicago, IL-IN-WI | 65.40% | 91.20% | 78.10% | 27.60% | 30.00% | 25.00% |
| Cincinnati, OH-KY-IN | 69.10% | 89.80% | 63.40% | 14.40% | 11.50% | 6.00% |
| Cleveland, OH | 66.60% | 87.90% | 57.60% | 14.60% | 11.70% | 6.60% |
| Columbus, OH | 61.20% | 86.80% | 52.80% | 5.00% | 3.60% | 6.90% |
| Dallas-Fort Worth, TX | 60.20% | 85.70% | 55.80% | 4.50% | 2.90% | 3.10% |
| Denver, CO | 64.50% | 88.50% | 74.50% | 20.50% | 17.10% | 9.90% |
| Detroit, MI | 71.50% | 87.40% | 68.10% | 15.80% | 5.70% | 5.40% |
| Fresno, CA | 55.00% | 74.20% | 42.50% | 2.30% | 3.90% | 2.20% |
| Grand Rapids, MI | 72.30% | 91.90% | 68.10% | 10.30% | 6.70% | 9.50% |
| Hartford, CT | 66.50% | 94.60% | 70.70% | 20.20% | 14.20% | 6.30% |
| Honolulu, HI | 59.70% | 80.80% | 43.60% | 32.30% | 33.60% | 48.80% |
| Houston, TX | 60.50% | 84.90% | 66.80% | 5.20% | 3.40% | 4.10% |
| Indianapolis, IN | 67.50% | 87.30% | 59.40% | 6.50% | 4.00% | 2.90% |
| Jacksonville, FL | 67.20% | 85.80% | 63.30% | 15.10% | 12.70% | 11.40% |
| Kansas City, MO-KS | 65.30% | 86.10% | 47.80% | 5.70% | 4.70% | 4.90% |
| Las Vegas, NV | 57.80% | 78.90% | 66.30% | 13.10% | 3.20% | 7.60% |
| Los Angeles, CA | 47.90% | 77.90% | 55.20% | 11.00% | 10.20% | 9.00% |
| Louisville, KY-IN | 69.20% | 88.40% | 70.20% | 11.10% | 13.90% | 5.80% |
| Memphis, TN-MS-AR | 60.80% | 77.80% | 41.20% | 4.20% | 7.80% | 6.80% |
| Miami, FL | 59.90% | 85.90% | 67.80% | 26.70% | 34.40% | 38.00% |
| Milwaukee, WI | 60.10% | 90.80% | 63.30% | 16.70% | 11.30% | 8.30% |
| Minneapolis-St. Paul, MN-WI | 70.50% | 94.40% | 75.00% | 20.20% | 12.00% | 12.10% |
| Nashville, TN | 65.00% | 86.00% | 72.30% | 7.10% | 3.60% | 4.50% |
| New Orleans, LA | 65.90% | 87.50% | 42.40% | 15.50% | 6.30% | 10.30% |
| New York, NY-NJ-PA | 51.70% | 91.40% | 74.50% | 26.70% | 16.80% | 23.00% |
| Oklahoma City, OK | 63.30% | 79.50% | 37.10% | 3.40% | 1.90% | 2.70% |
| Orlando, FL | 61.90% | 84.60% | 62.50% | 12.30% | 4.90% | 6.60% |
| Philadelphia, PA-NJ-DE-MD | 66.90% | 93.60% | 72.40% | 12.80% | 11.40% | 12.70% |
| Phoenix, AZ | 66.70% | 83.90% | 72.60% | 11.40% | 9.70% | 7.20% |
| Pittsburgh, PA | 70.50% | 88.50% | 58.50% | 10.50% | 7.10% | 5.70% |
| Portland, OR-WA | 61.60% | 86.50% | 55.90% | 9.50% | 7.40% | 8.70% |
| Providence, RI-MA | 62.80% | 91.60% | 64.90% | 23.50% | 17.70% | 7.10% |
| Raleigh, NC | 67.80% | 88.50% | 61.00% | 6.40% | 6.40% | 2.70% |
| Richmond, VA | 67.60% | 86.70% | 61.90% | 10.10% | 2.50% | 6.10% |
| Riverside-San Bernardino, CA | 65.80% | 81.10% | 54.90% | 7.30% | 2.90% | 3.20% |
| Rochester, NY | 67.90% | 91.00% | 60.50% | 9.10% | 8.90% | 5.70% |
| Sacramento, CA | 62.80% | 82.20% | 44.70% | 6.90% | 3.60% | 2.50% |
| Salt Lake City, UT | 67.60% | 89.70% | 69.90% | 17.90% | 11.40% | 5.90% |
| San Antonio, TX | 63.50% | 84.70% | 47.70% | 3.30% | 1.80% | 3.60% |
| San Diego, CA | 54.50% | 81.00% | 54.20% | 16.60% | 12.40% | 12.00% |
| San Francisco, CA | 56.20% | 83.90% | 67.10% | 18.50% | 13.20% | 14.00% |
| San Jose, CA | 54.90% | 81.40% | 61.40% | 15.30% | 11.10% | 5.40% |
| Seattle, WA | 59.80% | 86.50% | 64.40% | 16.60% | 15.60% | 7.90% |
| St. Louis, MO-IL | 69.70% | 86.80% | 63.40% | 12.80% | 11.10% | 7.10% |
| Tampa-St. Petersburg, FL | 67.00% | 84.40% | 74.20% | 20.70% | 28.20% | 21.90% |
| Tucson, AZ | 65.30% | 85.10% | 62.60% | 8.40% | 4.00% | 3.80% |
| Tulsa, OK | 65.70% | 82.90% | 42.50% | 3.30% | 2.90% | 4.40% |
| Virginia Beach-Norfolk, VA-NC | 64.20% | 86.60% | 62.80% | 9.60% | 8.10% | 7.00% |
| Washington, DC-VA-MD-WV | 63.90% | 91.20% | 76.40% | 20.20% | 25.30% | 18.40% |
| UNITED STATES | 65.2% | 86.1% | 64.5% | 14.3% | 12.6% | 13.4% |
What Percentage of Homes are Owned Free and Clear?
![]()
Between 2010 and 2022, we’ve seen a noticeable rise in homes owned free and clear. Back in 2010, about one in three homes (32.78%) were mortgage-free. Fast forward to 2022, and that number has climbed to nearly 40% (39.28%).
The Baby Boomer generation is the reason for this trend. Over half of those enjoying their homes without monthly mortgage checks are Boomers. This is because they have had more time to pay off their mortgages.
Percentage of Homes Without a Mortgage
| Year | Percentage of Homes Without a Mortgage |
| 2010 | 32.78% |
| 2011 | 33.58% |
| 2012 | 34.26% |
| 2013 | 35.68% |
| 2014 | 36.24% |
| 2015 | 36.73% |
| 2016 | 36.96% |
| 2017 | 37.19% |
| 2018 | 38.08% |
| 2019 | 38.26% |
| 2020 | 37.85% |
| 2021 | 38.71% |
| 2022 | 39.28% |
Sources:
- fred.stlouisfed.org/series/RHORUSQ156N
- census.gov/housing/hvs/data/rates/tab3_state05_2024_hmr.xlsx
- bankrate.com/home ownership/home-ownership-statistics/#average-age
- redfin.com/news/homeownership-rate-by-generation-2023/
- nar.realtor/women-home-buyers
- nar.realtor/sites/default/files/documents/2024-snapshot-of-race-and-home-buying-in-america-02-20-2024.pdf
- newgeography.com/content/008228-home-ownership-type-residential-building
- investopedia.com/percent-homeowners-have-mortgage-8680325
