
2026 For Sale By Owner (FSBO) Statistics By State
Key For Sale by Owner (FSBO) data findings:
- The FSBO sales market share dropped to about 6% of all home sales in 2024. This is an all-time low, indicating that more sellers choose to hire real estate agents.
- In 2023, the average sales price for FSBO homes was $380,000. This was $55,000 lower than the average sales price for agent-assisted home sales.
- Just 11% of FSBO sellers successfully complete the sale without involving a realtor at some point in the process. This highlights the low FSBO success rate. 10% eventually switch to using a realtor after encountering challenges.
- 75% of FSBO sellers still end up paying the buyer agent’s commission of between 2.5% and 3%. However, this may change with the new NAR rules on buyer agency.
- FSBO sellers struggle most with pricing correctly (17%), selling on time (13%), and navigating paperwork (10%).
Wondering how FSBO compares to selling through a realtor? We’ll compare both methods of home selling by using facts and data.
If you’re a homeowner considering selling your property, or a real estate agent looking to know more about the state of FSBO sales this year, then you’ll find a lot of value in this post.
We have collected FSBO sales and listings data from trusted sources such as the National Association of Realtors (NAR), Redfin, Zillow, and FSBO platforms like Forsalebyowner.com.
Our analysis of realtor vs for sale by owner statistics will provide you with a comprehensive understanding of the pros and cons of each approach.
For Sale By Owner Statistics: The Current State of FSBO
In 2024, FSBO sales made up just 6% of the total share of home sales, according to the latest FSBO stats from the NAR.
This was an all-time low. Experts attribute this drop to changing market conditions, the paperwork requirements of today’s real estate transactions, or just a growing preference for agent-assisted sales.
If we look at the historical FSBO data, we see a slow decline in the percentage of FSBO home sales from 2008 to 2018.
There was a slight increase in 2019, which was short-lived. We can also see a notable rise to 10% in 2022.
That was because the low inventory of homes led to a strong seller’s market. But in 2023 and 2024, the rate dropped back down to 7% and 6%, respectively. These are the lowest rates on record since the time NAR began collecting FSBO data.
In the last decade, FSBO sales have not gone beyond 10% of all home sales. What that shows is that people still prefer using the services of real estate professionals when selling a home.
For the small percentage of people who opt for FSBO, the primary motivation is to avoid realtor commissions, which are the heftiest part of home seller closing costs.
On the average real estate transaction, the commission for real estate agents is between 5%-6% of the final sale price. The majority of people opting for FSBO do not want to pay this on top of the rest of their closing costs.
However, FSBO closing costs stats show that even when compared to the cost of selling a house with a realtor, they actually save up to 6% in commissions, they incur a net loss in terms of home value, which often exceeds 14%.
FSBO homes typically sell for less than realtor-assisted homes. In 2023, the average FSBO home sold for $380,000. Conversely, the average agent-assisted home sold for $435,000. That’s a whole $55,000 difference.
Based on the above data alone, it’s easy to see why there has been an uptick in sellers opting to use real estate agents. 90% of sellers now sell with the help of an agent. That’s up from 89% in 2023.
Most FSBO sellers (38%) claim that the reason for going solo was because they knew the buyer. The people buying FSBO houses for sale were usually either friends, relatives, or neighbors of the sellers.
17% of them also identified getting the price right as the most difficult step in the selling process. 13% found it hard to sell within their planned time frame, and 10% thought the paperwork process was the most stressful part of selling.
Percentage of FSBO Home Sales
| Year | Percentage of Home Sales That Were FSBO |
| 2008 | 13% |
| 2009 | 11% |
| 2010 | 9% |
| 2011 | 9% |
| 2012 | 9% |
| 2013 | 9% |
| 2014 | 9% |
| 2015 | 8% |
| 2016 | 8% |
| 2017 | 8% |
| 2018 | 7% |
| 2019 | 8% |
| 2020 | 7% |
| 2021 | 7% |
| 2022 | 10% |
| 2023 | 7% |
| 2024 | 6% |
State-by-State FSBO Statistics
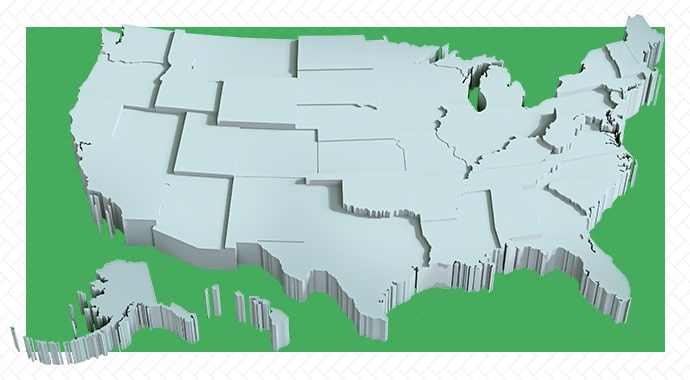
We determined the total number of FSBO listings by looking at Forsalebyowner.com and Zillow.com data for each state (as of November 2024).
Then, we calculated the FSBO percentage by dividing the number of FSBO listings by the total number of listings for each state. Based on our calculations, here’s a summary of for sale by owner statistics by state:
- FSBO preference varies widely by state. Hawaii, for example, has the lowest FSBO listing percentage (0.92%), while Ohio (13.61%), Texas (13.22%), and Indiana (12.76%) have the highest rate of FSBO.
- Southern states show a higher preference for FSBO. North Carolina, for example, has a FSBO listing percentage of 10.81%; South Carolina has 11.52%; Texas has a FSBO listing rate of 13.22%, and Florida is at 7.65%.
- Texas (30,000 listings) and Florida (17,969) have the highest FSBO listing volume on the Forsalebyowner.com platform (the major online listing platform used by FSBO sellers).
That’s because these states have the highest number of homes for sale generally (as per Zillow). These two states lead in terms of FSBO sales volume.
For Sale By Owner Statistics by State
| State | Estimated FSBO Percentage (%) | FSBO listings as of November 2024 (Forsalebyowner.com) | Zillow listings (November 2024) |
| Alabama | 6.82 | 2,397 | 35,215 |
| Alaska | 1.75 | 66 | 3,762 |
| Arizona | 12.34 | 6,142 | 49,779 |
| Arkansas | 4.39 | 1,060 | 24,148 |
| California | 5.80 | 5,986 | 103,214 |
| Colorado | 9.71 | 3,697 | 38,065 |
| Connecticut | 5.64 | 337 | 5,978 |
| Delaware | 11.97 | 518 | 4,328 |
| Florida | 7.65 | 17,969 | 235,013 |
| Georgia | 7.90 | 4,991 | 63,176 |
| Hawaii | 0.92 | 64 | 6,920 |
| Idaho | 6.39 | 978 | 15,299 |
| Illinois | 7.53 | 2,431 | 32,269 |
| Indiana | 12.76 | 3,290 | 25,784 |
| Iowa | 2.04 | 352 | 17,246 |
| Kansas | 3.15 | 326 | 10,335 |
| Kentucky | 9.59 | 1,911 | 19,930 |
| Louisiana | 4.48 | 1,446 | 32,270 |
| Maine | 2.39 | 167 | 6,989 |
| Maryland | 5.18 | 794 | 15,324 |
| Massachusetts | 2.96 | 346 | 11,686 |
| Michigan | 8.52 | 3,203 | 37,582 |
| Minnesota | 6.65 | 1,532 | 23,036 |
| Mississippi | 3.16 | 514 | 16,241 |
| Missouri | 3.92 | 1,158 | 29,578 |
| Montana | 2.20 | 230 | 10,471 |
| Nebraska | 3.49 | 309 | 8,861 |
| Nevada | 11.81 | 1,992 | 16,864 |
| New Hampshire | 3.91 | 145 | 3,705 |
| New Jersey | 8.52 | 1,641 | 19,256 |
| New Mexico | 3.77 | 510 | 13,521 |
| New York | 8.78 | 1,900 | 21,640 |
| North Carolina | 10.81 | 6,619 | 61,210 |
| North Dakota | 1.66 | 74 | 4,446 |
| Ohio | 13.61 | 4,086 | 30,019 |
| Oklahoma | 6.42 | 1,795 | 27,973 |
| Oregon | 6.03 | 1,280 | 21,210 |
| Pennsylvania | 7.71 | 2,871 | 37,224 |
| Rhode Island | 4.20 | 71 | 1,690 |
| South Carolina | 11.52 | 4,231 | 36,738 |
| South Dakota | 1.64 | 96 | 5,837 |
| Tennessee | 5.35 | 2,466 | 46,103 |
| Texas | 13.22 | 29,992 | 226,840 |
| Utah | 9.04 | 1,738 | 19,228 |
| Vermont | 5.37 | 151 | 2,813 |
| Virginia | 8.17 | 2,203 | 26,981 |
| Washington | 7.32 | 2,087 | 28,494 |
| West Virginia | 5.78 | 389 | 6,728 |
| Wisconsin | 5.90 | 1,261 | 21,382 |
| Wyoming | 1.78 | 81 | 4,540 |
Top 10 States for FSBO Home Sales
The states with the highest percentage of FSBO sales are spread across different regions. But what we see is that FSBO is more common in the South than anywhere else.
- Midwest: In the heart of the Midwest, Ohio leads the pack with the most frequent FSBO sales. Indiana follows closely as the state with the third-highest rate of FSBO.
- South: Down South, Texas takes the crown. It is the state with the second-highest rate of FSBO. South Carolina, North Carolina, and Kentucky also made the top 10 list.
- West: The West is a mixed bag. States like Arizona have high FSBO rates, while states like Montana and Wyoming have some of the lowest rates. In the West, Arizona, Colorado, and Nevada are the states with the highest FSBO listing rates.
- East: Delaware is the only state in the East with a notably high percentage of FSBO listings.
Ohio, with its affordable average listing price of about $205,000, tops the list. With a lower-than-average median price, Ohio sellers would want to maximize profit by cutting out the middleman to pocket more from their sales.
Texas has a fast-growing population and a comparatively hot housing market. This makes it easier to find buyers, contributing to its high rate of FSBO listings.
In Arizona and Indiana, the same applies. In these states, a growing economy fuels real estate market activity. This prompts folks to try selling their homes on their own.
Remember, while the percentages provide a relative measure, a state like Texas, with its huge population and vibrant real estate market, will naturally have more FSBO listings than a small state like Delaware.
Also, you should understand that in most cases, high FSBO percentages may reflect specific local real estate investment market trends.
For example, states like Texas and Arizona top the list for FSBO currently because of their robust real estate markets. If the markets were down in these states, we would likely see more people opting for realtor assistance or selling their houses to an investor.
| Rank | State | Estimated FSBO Percentage (%) |
| 1 | Ohio | 13.61 |
| 2 | Texas | 13.22 |
| 3 | Indiana | 12.76 |
| 4 | Arizona | 12.34 |
| 5 | Delaware | 11.97 |
| 6 | Nevada | 11.81 |
| 7 | South Carolina | 11.52 |
| 8 | North Carolina | 10.81 |
| 9 | Colorado | 9.71 |
| 10 | Kentucky | 9.59 |
10 States With the Lowest Number of FSBO Sales
In the tight-knit communities of Hawaii, South Dakota, North Dakota, Alaska, and Wyoming, FSBO sales are not so common. These states have a low share of FSBO listings to total listings, ranging from 0.92% in Hawaii to 1.78% in Wyoming.
The common threads in these states are low population and real estate markets that are much more localized. For example, if you wanted to sell a home in Ketchikan, Alaska all by yourself, it’s going to take you much longer to find a buyer than if you were to sell in Dallas, Texas.
We can assume that another reason FSBO is so uncommon in a market like Hawaii is because of sky-high home prices and high living costs. You can expect buyers to drive hard bargains. This is why most homeowners here prefer a pro to guide them.
In markets like South Dakota and North Dakota, homeowners stick with experienced agents because they can offer their homes more exposure. Going with a pro, these sellers can sell their homes on time and squeeze out the best price.
Alaska’s challenging geography and thin population complicate FSBO efforts, pushing most to trust local agents who know the ropes.
If we look deeper into these states, we’ll find a slight variation in FSBO rates between rural and urban areas.
A 2021 report from Zillow showed that in rural areas, 7% of all listings are likely to be FSBO listings. In suburban and urban areas, this number dropped to 5% and 4%, respectively.
| Rank | State | Estimated FSBO Percentage (%) |
| 1 | Hawaii | 0.92 |
| 2 | South Dakota | 1.64 |
| 3 | North Dakota | 1.66 |
| 4 | Alaska | 1.75 |
| 5 | Wyoming | 1.78 |
| 6 | Iowa | 2.04 |
| 7 | Montana | 2.20 |
| 8 | Maine | 2.39 |
| 9 | Massachusetts | 2.96 |
| 10 | Kansas | 3.15 |
FSBO vs Realtor Statistics
Now, let’s look at the latest FSBO vs agent statistics:
- Only 6% of 2024 home sales were FSBO, the lowest on record.
- In 2023, FSBO homes sold for a median of $380,000, $55,000 less than agent-assisted sales.
- 94% of FSBO sellers offered no buyer incentives.
- Despite trying to avoid commissions, 75% of FSBO sellers still paid a buyer’s agent commission of around 2.5% to 3%.
- Only 11% of FSBO sellers successfully sell their homes without hiring a realtor. After trying it themselves for a while, 10% switch to agents due to the complexity and stress involved. Conversely, realtors have a 90% home-selling success rate.
- When they do offer incentives, FSBO sellers offer costlier incentives such as repair credits (which can be up to 6% of the sale price if selling a house that needs a lot of work). Agent-assisted sellers offer cheaper incentives like home warranties.
Reasons for FSBO
- 38% of FSBO sellers sold to acquaintances (a friend, relative, or neighbor).
- 30% of FSBO sellers wanted to avoid paying commissions.
Most difficult steps
- 17% of FSBO sellers struggled with setting the right price.
- 13% found it difficult to sell on time.
- 10% struggled with navigating paperwork.
| FSBO Statistic | Detail |
| FSBO Market Share | 6% of all home sales in 2024 |
| Sales Price Difference | FSBO homes sell for $55,000 less than agent-assisted sales |
| Buyer’s Agent Commission | 75% of FSBO sellers still pay a buyer’s agent commission |
| Buyer Incentives Offered | FSBO sellers offer more costly incentives, up to 6% of the sale price |
| FSBO Success Rate | Only 11% of FSBO sellers succeed without hiring a realtor |
| MLS Listings | Only 3% of FSBO sellers list on the MLS |
| Pricing Challenges | 17% of FSBO sellers find pricing the most difficult task |
| Paperwork Issues | 36% of FSBO sellers make legal mistakes |
| Buyer Incentives | 94% of FSBO sellers offer no buyer incentives |
| Urgency to Sell | Only 49% of FSBO sellers who don’t know the buyer are in a rush to sell |
Realtor vs FSBO Pros and Cons
FSBO Pros
- No listing agent commission: While you might still have to pay the buyer’s agent commission, with FSBO, you generally save money on the listing agent’s commission.
This means you pocket the 2.5% to 3% of your home’s sale price that would have been paid to a listing agent.
- Complete control: If you opt for FSBO selling, you decide everything about your home’s sale. You can market your home however you want, set the list price, and select whatever offer you like.
- You might sell faster: The majority of FSBO sales (38%) are to family members, neighbors, or friends. If you already have a buyer lined up, you can bypass the process of listing and showing the property.
- Personal knowledge of the property: Since they have firsthand experience living in their homes, owners can highlight the unique features of their properties. They can also handle any concerns or questions potential buyers have on the spot.
FSBO Cons
- You sell for less: The stats show that FSBO homes sell for lower prices than realtor-marketed homes. The NAR reported that FSBO homes sold for a median of $380,000 in 2023. That’s $55,000 less than agent-assisted home sales.
- FSBO can take more time: In cases where you don’t have a seller already lined up, your home might spend longer on the market than necessary.
Incorrect pricing and inadequate marketing cost home sellers time when trying to sell on their own. Also, some buyer’s agents may avoid FSBO listings because these types of deals net them less money.
- Limited market exposure: FSBO sellers cannot market their properties on the Multiple Listing Service (MLS). This is a database real estate agents use to share property listings with other agents.
To share a property on the MLS, FSBO sellers have to hire a flat fee MLS broker, which adds to their costs.
- Negotiation challenges: FSBO sellers often offer costlier incentives because they aren’t skilled at negotiations. Homeowners may not be able to look at offers objectively.
They might also not be able to look beyond the monetary offer to consider contingencies such as home inspection and appraisal contingencies.
- Legal and financial risks: Sellers aren’t usually well-versed in real estate law. They can easily overlook critical disclosures or draft sale documents improperly. This can lead to legal issues down the line.
Realtor-Assisted Sales Pros
- Marketing and negotiation skills: Realtors have undergone training on marketing homes and negotiating offers.
Apart from using the MLS, they market homes through channels like social media, online listing platforms, and their own professional networks. This ability to garner more eyeballs and negotiate offers is why realtor-marketed homes typically net more than FSBO homes.
- Professional expertise: A realtor likely has years of on-field experience selling homes in a particular area. This means you can trust them to ensure the whole process goes smoothly.
- Handling paperwork and red tape: Realtors manage the administrative burden that comes with home sales. They help sellers navigate paperwork and legal requirements.
- Access to professional networks: When you hire a realtor, you get access to their extensive network, including lenders, contractors, and home stagers. This is helpful if you’re looking to buy immediately or want to boost your home’s appeal and net more profit.
Realtor-Assisted Sales Cons
- No guarantee of a quick sale: Using a realtor doesn’t guarantee your home will sell fast or that it’ll attract serious buyers. Much of home selling depends on market conditions.
If speed is important for you, the best way is to use a real estate cash buyer (a “we buy houses fast” company) that looks for investment properties for sale at a discount.
- Home staging requirements: When you’re working with a realtor, you might be required to stage, clean, and make some repairs before listing the home, if you don’t want to lose money by selling a house as is.
- Listing agent fees: If you work with a realtor when selling your home, then you have to pay both the buyer agent’s and the listing agent’s commissions.
Usually, that means you have to pay 5-6%. But, as of August 2024, paying the buyer agent’s commission is optional for sellers.
- Disruptive open houses and showings: One of the negatives of listing your home through an agent while you’re still living in it is that you periodically need to vacate the property and prepare it for showings and open houses.
This can be inconvenient and intrusive.
Challenges Faced by FSBO Sellers
1. Pricing Correctly
Nailing the perfect price tag is the most difficult part of the process for 17% of FSBO sellers.
Why? Because emotions and guesswork just don’t cut it when trying to sell a home.
It’s all too easy for FSBO sellers to let their fond memories inflate the price without finding the fair market value of the home. FSBO sellers may price their home without looking at market conditions, updates, upgrades, or the home’s unique features.
But the danger is that overpricing leads to longer days on the market. The longer your home waits on the market, the more buyers start to wonder what’s wrong.
When a house outstays its welcome on the market, expect its price to fall. On the other hand, underpricing means you make less profits from the sale.
2. Handling Paperwork
10% of FSBO sellers admit that understanding and filling out paperwork is their biggest headache.
Imagine having to deal with over 20 pages of complicated paperwork, including the main contract and addendums. Closing time isn’t just about popping champagne. It’s a paper marathon.
You are required to make specific disclosures and documentation, depending on the state you live in and the type of property.
For example, if your house was built pre-1978, you must have an addendum regarding selling a house with lead-based paint. Each state has its own rulebook. Some states even require having carbon monoxide detectors.
Without a thorough knowledge of these rules, you would likely skip over them. This might not just delay your sale. It could open the door wide to legal troubles.
3. Marketing Strategies
FSBO sellers do not have access to the MLS. For many of them, the primary way to market is via yard signs, social media, and maybe local real estate websites.
Plus, when you have a day job, you’re not going to have enough time to spend trying to advertise your home listing.
But if you want to sell fast, you need to reach a broader audience. This is where real estate agents excel.
They not only have access to the MLS, but they can also leverage their extensive networks and various marketing channels, including open houses, magazine placements, and sometimes targeted ads, to reach more home buyers.
Sources:
- realestateagentpdx.com/for-sale-by-owners-homes-sell-for-much-less-annual-report/33349
- nar.realtor/sites/default/files/2024-11/2024-profile-of-home-buyers-and-sellers-highlights-11-04-2024_2.pdf
- listwithclever.com/real-estate-blog/fsbo-statistics/#regrets
- www.nar.realtor/sites/default/files/2024-11/2024-profile-of-home-buyers-and-sellers-highlights-11-04-2024_2.pdf
